Introduction to Stock Charts
Becoming familiar and learning how to read stock charts is an important aspect if you want to become a better trader & investor. By learning how to interpret a stock chart will help you better understand a stock’s price movement.
A stock chart can provide you with a wealth of knowledge as long as you know and understand what you’re looking at. Basic charting knowledge combined with other stock indicators can immensely improve your trading skills.
What many people don’t realize is that technical analysis is just basically analyzing stock charts. So, lets take a look at the stock chart.
What is a Stock Chart
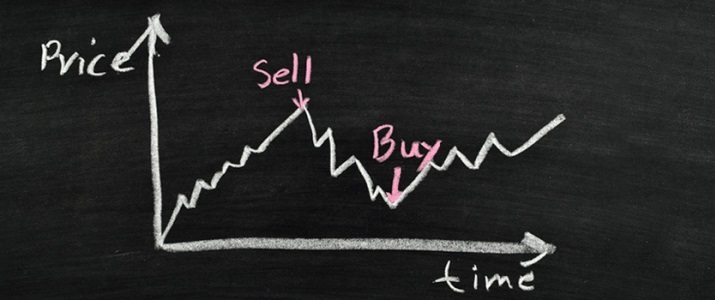
A stock chart is simply a graphical representation of the stocks price over a set period of time that shows the past prices of a particular stock. Stock charts are used to help traders and investors make decision on buying or selling stocks.
Stock charts basically show the history of the stock and where it has traded at. Depending on the particular time frame you are viewing, the price movement can be plotted on a day by day, minute by minute, hour by hour basis and other time frames.
If you have a brokerage account then chances are you have seen a variety of stock charts.
If you are new to stocks, there are a variety of websites where you can get free stock quotes and view quality charts. Here are a few examples:
How to Read Stock Charts
Reading a stock chart is simple and straight forward. Once you have viewed a few stock charts you’ll start understanding how to read them.
Let’s pull up a chart and go over some of the main areas. For our example we will be using the chart of Apple. When you first look at a chart there are 3 key areas you want to become familiar with:
1. Time scale (X axis)
2. Price scale (Y axis)
3. Volume
Time scale (X axis):
The time scale or the “X” axis is the bottom portion of the graph, running horizontally, and it flows left to right. It’s the portion of the graph that has the time frame that you are looking at.
The current time frame for the chart above is set at 1-year. The time frame can easily be adjusted to a shorter or longer period of time. The most frequently used time scales are intraday, daily, weekly, monthly, quarterly and annually. Any adjustments of the time frame will give you a different perspective on the stock.
Price scale (Y axis):
The price scale or the “Y” axis is the right side of the chart, running vertically. This portion of the graph has the price action where it shows a stock’s current price and compares it to past data points.
So, from the Apple stock chart above we can see that the stock has traded in a price range between $400-700 in the past year.
Volume:
For traders, the volume is another important data piece to look at. A stock’s volume is a measure of the number of stock shares that have been exchanged or traded within a specific period of time. It’s essentially how much buying and how much selling was going on within that period of time.
You could think as volume as the heart of that stock because it is what moves the stock higher or lower. When you see large spikes in volume it means many traders were involved in that movement.
Now that you have become familiar with the basic key areas of a stock chart let’s go over the 3 basic chart types that are used.
Chart Types
There are three main types of charts that are used by investors and traders.
The chart types are:
-
- line chart
- bar chart
- candlestick chart