The head and shoulders chart pattern is a classic pattern in technical analysis where it signals a reversal trend.
It is one of the most well known patterns among traders. Just like the name implies, the pattern looks like a head with two shoulders.
The head and shoulders pattern is a reversal chart pattern that when formed, signals that the stock is likely to move against the previous trend.
There are two versions of the head and shoulders chart pattern: a head and shoulders top and an inverse head and shoulders.
Head and Shoulders top
A head and shoulders top is basically formed by a peak (shoulder), followed by a higher peak (head), and then by another lower peak (second shoulder).
A “neckline” is drawn by connecting the lowest points of the two troughs. The neckline is a level of support or resistance and the pattern is confirmed when the neckline is broken, after the formation of the second shoulder.
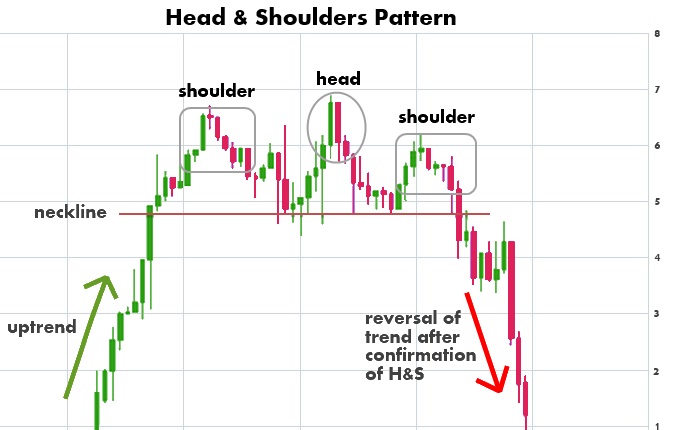
A head and shoulders top is formed at the high of an upward movement and signals that the upward trend is about to end and that the trader should sell their position in the stock.
Inverse Head and Shoulders
A head and shoulders can also be formed in the opposite direction. This type of pattern is know as an inverse head and shoulders or a head and shoulders bottom. This signals that a stocks’s price is set to rise and usually forms during a downward trend.

A inverse head and shoulders is formed at the low of a downward movement and signals that the downtrend has the potential to end. This formation signals a trader should take a position in a stock and begin buying.
The Neckline of the Head and Shoulders
The neckline serves as a support level on a head and shoulders top and a resistance level on an inverse head and shoulders.
When the neckline is broken then it is a confirmed head and shoulders pattern and signals a trend reversal and the stock should be heading in a new direction. The break through the neckline is when most traders following the pattern would take a position in the stock.