There’s a lot of thought on whether chart patterns are cracked up what many say they are.
Some traders don’t use them at all, while some trades live by them and only trade when they see a certain chart pattern.
So, are chart patterns worth your time?
Well, I guess it all depends on your trading style.
But for me, I say YES chart patterns can work when used in the right way.

Chart patterns play a large role in technical analysis. They give buy and sell signals and help traders to determine with more accuracy the direction a stock is headed.
Chart patterns can help identify trend reversals and continuations.
The great thing about chart patterns is that they repeat themselves over and over again. And when you see a pattern that you recognize you will know how to trade it and will increase your chances of a successful trade.
Lets take a look a 5 well known chat patterns that can help you maximize your trading profits.
1. Cup and Handle
The cup and handle is one of the neatest looking chart pattern when you spot one.
Named after its appearance because it resembles a cup and handle, this pattern is considered a bullish continuation pattern and is formed within an uptrend.
This pattern is the result of a consolidation period in a stock, with the round cup shape followed by narrow price action which forms the appearance of a handle.
The technical buy point is when the stock breaks above the handle area to the upside.

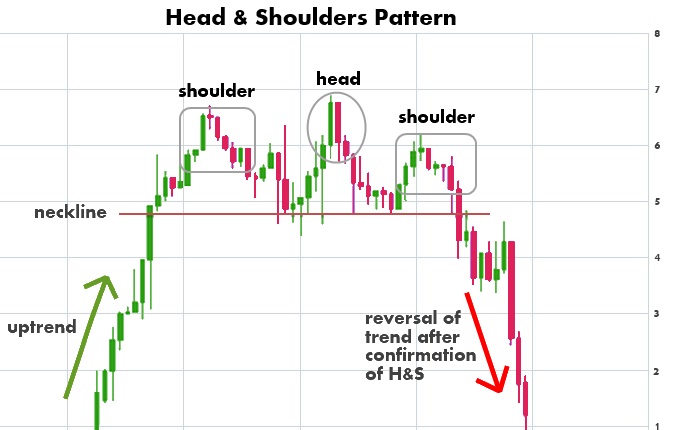
2. Head and Shoulders
The head and shoulders pattern is a reversal pattern that and when formed it signals the stock is likely to move against the previous trend.
If you are long a stock and see a head and shoulders pattern forming, then it is a great signal to sell your position as the trend is about to reverse.
A head and shoulders can also be formed in the opposite direction. This type of pattern is know as an inverse head and shoulders or a head and shoulders bottom. This signals that a stocks’s price is set to rise and usually forms during a downward trend.
A inverse head and shoulders is a great technical buy signal as the stock is likely to begin an uptrend.

3. Flag
Flags are considered as continuation patterns and can be found in both an uptrend and a downtrend.
The flag pattern is formed when a steep rise (or fall) creates what is known as the “flag pole”. It is then followed by the stock consolidating where it trades in a narrow price range and creates the “flag”. The stock then breaks out of that narrow trading range and moves higher (or lower).
Below is an example of a bullish flag chart pattern:

4. Pennant
Pennants are similar to flags and are also considered continuation patterns, and can form in both an uptrend and a downtrend as well.
A pennant chart pattern contains a similar looking “flag pole” as the flag pattern, just the consolidation period forms a different shape.
A pennant chart pattern is formed when a steep rise (or fall) is followed by the stock consolidating and trading in a narrow price range. During this narrow trading range it takes the shape of a symmetrical triangle (the pennant).
After the stock breaks out of that narrow trading range, the previous trend continues.
Below is an example of a bullish pennant chart pattern:

5. Double Top and Bottom
Double top and double bottom chart patterns are reversal patterns and signal the previous trend will likely reverse.
These patterns are formed after a sustained uptrend for a double top and a double bottom forms at the end of a downtrend.
or downtrend and signal to a trader that the trend is about to reverse. The pattern is created when a price movement tests support or resistance levels twice and is unable to break through and ultimately reverses direction.
Double Top
The double top pattern is formed after a period of an uptrend, and the pattern is formed after the stock reaches a level of resistances and falls back to a level of support. The stock then rises again and reaches the same level of resistances.
After two unsuccessful attempts of the stock trying to move higher, the stock falls through the level of support and the trend reverses and the price heads lower.
For traders, a double top is a technical sell signal or short sell signal.

Double Bottom
The double bottom pattern serves as a technical buy signal and is basically the opposite of the double top pattern.
This chart pattern is formed after a period of a downtrend, and is formed after the price movement of the stock went lower twice, but found support each time.
After the second bounce off of the support line, the trend reverses and the price heads higher where it breaks through the resistance line.